History
Under this tab, the recent history of drought in Sri Lankan is presented. A case study for the district of Polonnaruwa has been studies especially to present the situations that have prevailed in this area which is generally affected.
Drought
Drought and its impacts could be a complex phenomenon to pin down – but in times of extreme the link between climate and the impacts of drought are quite clear. The impact on people (access to water), their livelihood and well being (water supply, health, threats of human-elephant-conflict) and the overall economy bring these out. Different households, farmers, plantations and industrialists may have have differentiated vulnerability to drought and differentiated capacity to mitigate drought. This is indeed the case with the recent drought in Sri Lanka from 2016 to around October 2017. The spatial and seasonal character may vary and a sudden rainfall event may modulate the drought. In this drought monitor, we are seekig to provide a summary of the conditions along with resources in a portal for deeper understanding and better planning and decision making. The state response to drought has historically been to distribute water, food and crop relief and other relief through the Ministry of Social Services. The focus is on post-disaster response. Through this portal, monitoring of climate and environmental conditions and predictions we hope that we could support anticipatory disaster risk management.
Rainfall and Drought
Rainfall and its variation has the most direct influence on drought. If rainfall is less than what is typically expected and what folks and the ecosystems have grown accustomed to, then the impacts shall follow. Rainfall variation for drought monitoring needs to be done in near-real time. We have been working on various procedures so that we can overcome the nationally counter-productive data policies and pricing in place so as to bring out real time monitoring. We have found that satellite based data, some data that are accessible online and our own automated weather stations (which we provide unfettered access to) can be combined to estimate rainfall deficits. Below in Fig. 1 for example is a comparison of the current years rainfall with that in the previous years. We can see that in 2016 after the massive floods around 14-19th of May, rainfall has stayed well below what has been seen in previous years.
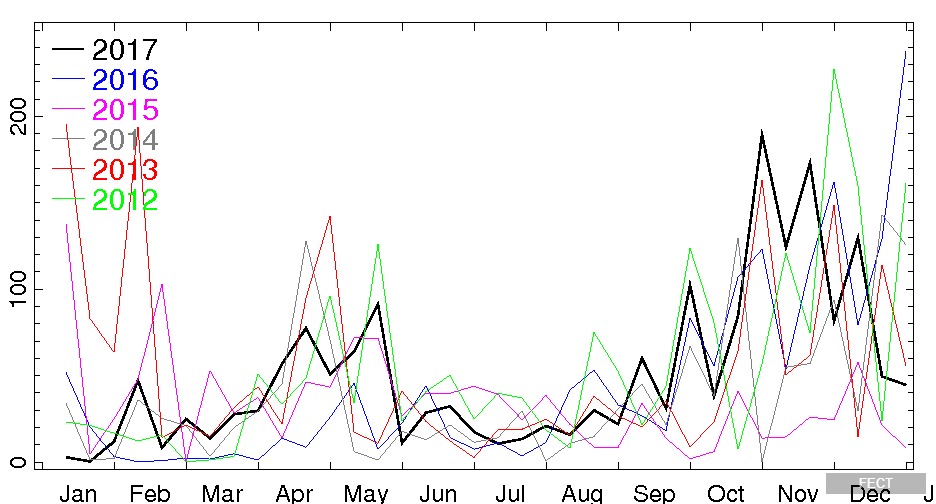
Figure 1: Dekadal (10-days or 3 per month) precipitation comparison for Sri Lanka: The average rainfall for each dekad over Sri Lanka estimated from satellites and ground observations is shown for the last 6 years as a line in a separate colour over a common January – December axis with 2017 in bold black. Figure 1 is already a harbinger of drougt in Sri Lanka by early January 2017. The deficits were sustained through April across Sri Lanka.
A more explicit way to look at drought is to compare the current rainfall average with that for the long-term average. This is what has been done in Figure 2. This too shows that the rainfall has been below average in a sustained way.
Fig 2. Dekadal precipitation of past four years and 2002-2017 average for Sri Lanka: The smoother curve shows the average over 2002-2016 – this annual cycle is reproduced for each year in the above figure. The departures from this average are shown wetter (blue) and dryer (brown) for each month for the last three years. A dekad refers roughly to 10 days or more accurately as each month divided into three.
The climate of Sri Lanka has considerable regional variation – to undertand this, we can look at the month-by-month variation in rainfall anomalies (Fig. 3) – i.e the departure from the long-term average. The maps show more nuance and can be interpreted accordingly for various regions.
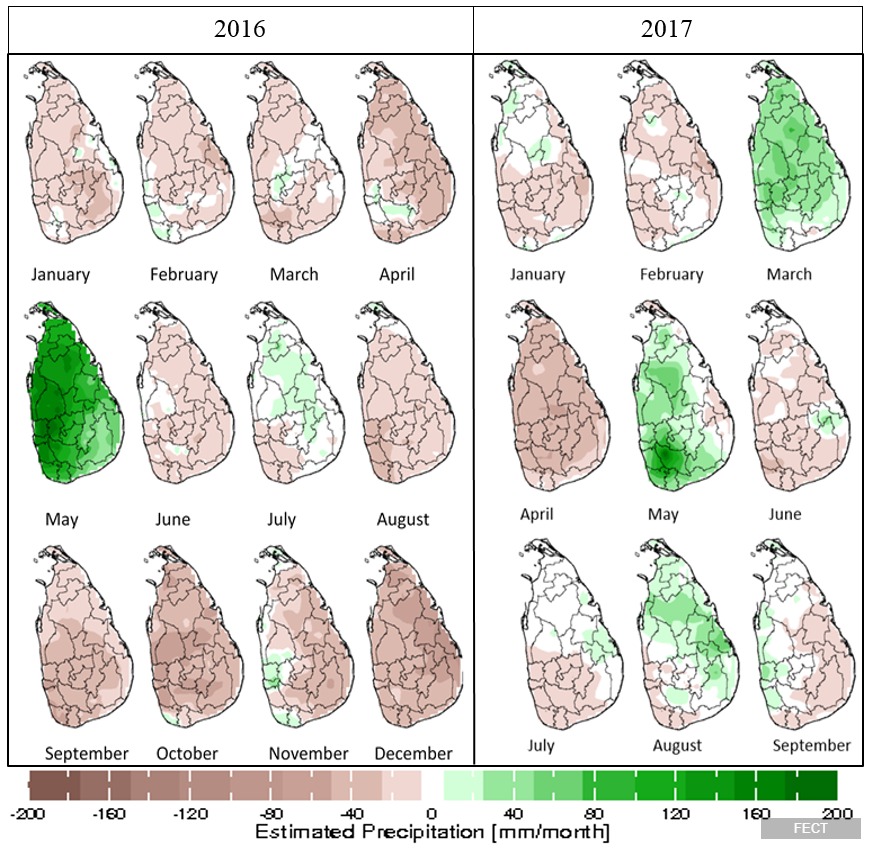
The monthly rainfall anomalies shown in Figure 3 shows that apart from extreme rainfall received in May the rainfall largely remained below average throughout 2016. In 2017, the island received above average rainfalls in the months of March, May and August. Mostly below average rainfall conditions were observed in the rest of the year. Results based on ground observed data (Figure 3) confirm our findings based on the satellite based data above.
Drought Indices for Polonnaruwa District
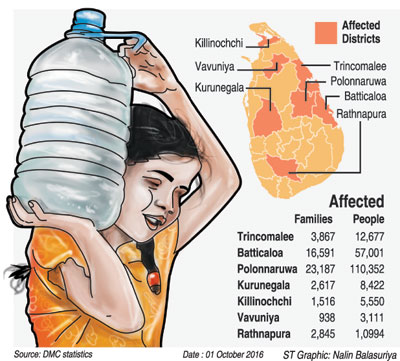
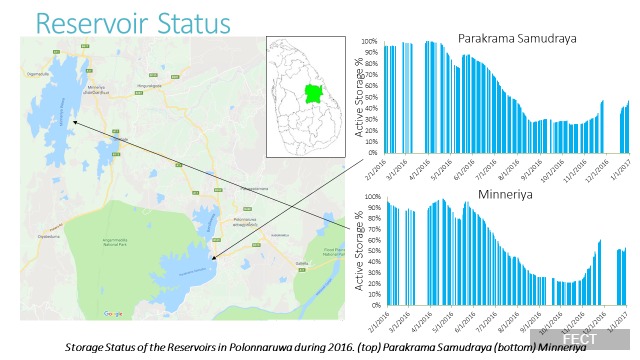
Polonnaruwa district in the north central province of the island was for a while the epi-center of the 2016 drought in Sri Lanka. This severely affected the Rice production along with many other crops. The situation was accentuated with many reservoirs running dry and over a hundred thousand people directly affected. Figures 7 and 8 depict the severity in terms of people affected and storage capacities in reservoirs.
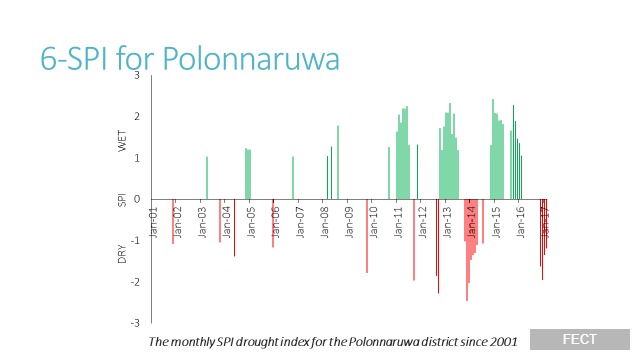
Researchers have developed a number of tools to help define the onset, severity and end of droughts such as the SPI and WASP Index. Given below is the SPI index its definition and the results received for the Polonnaruwa district as shown in figure 5.
SPI Index
- The Standardized Precipitation Index (SPI) was developed by McKee et al., 1993 primarily for defining and monitoring droughts at different time scales.
- SPI is calculated on a monthly basis for a moving window of n months, where n indicates the rainfall accumulation period, typically 1-to-36 months, using monthly input data.
- Drought events that have six-month SPI values of less than -1.0 for at least two consecutive months were considered.
- Using this measure, drought onset is defined as the first month that the SPI indices becomes negative; it terminates when the index becomes positive.
- Accumulated precipitation deficits were computed over the duration of individual drought events identified using the SPI.

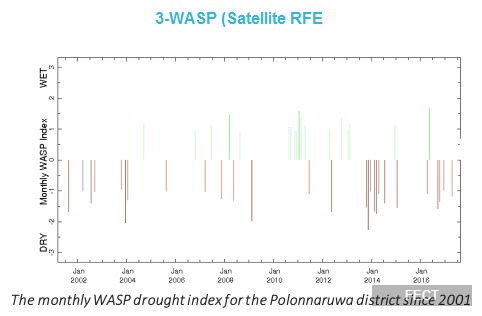
The WASP Index
- WASP (Weighted Anomaly Standardized Precipitation) index and is based solely on monthly precipitation data (Lyon, B., 2004). (3-WASP, 6-WASP and 12-WASP)
- Standardized precipitation anomalies weighted according to the fraction of mean annual precipitation at the given time of year.
- If the WASP index is between -1 and -2 it is defined as “moderately dry”, and between -2 and -3 is “very dry” and if the index is below -3 it is “extremely dry”.
Given below in figure 7 are the results of the WASP Index for Polonnaruwa.
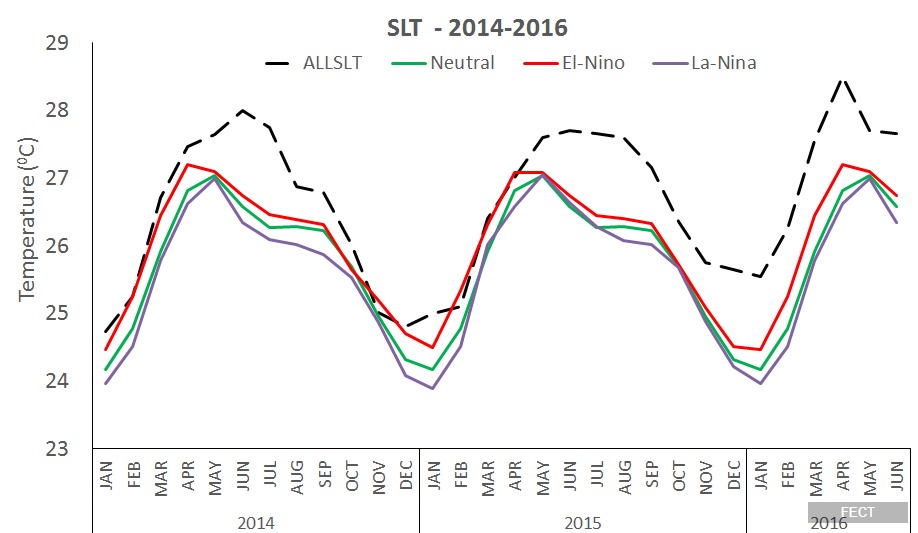
Role of El Nino and La Nina in Sri Lanka
Variation of Rainfall averaged over Sri Lanka over the last few years as compared with what is typical for El Nino and La Nina phases. Variation of Temperature averaged over Sri Lanka over the last few years as compared with what is typical for El Nino and La Nina phases. These variations are shown in figure 6.