Impact on Agriculture
The results of a dryer weather are also found in the production of other crops such as paddy, tea, rubber and coconuts.
- Rice Production
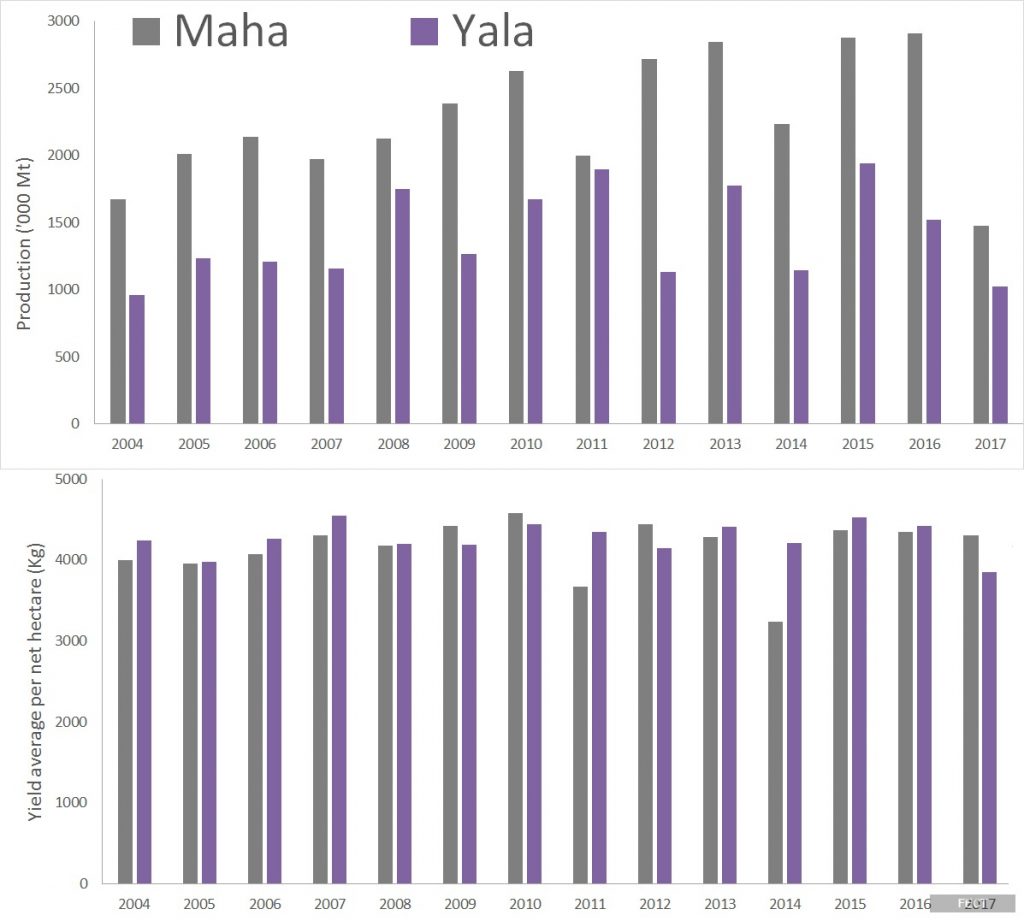
Rice as the mainstay of the Sri Lankan diet and on which the livelihoods of many farmers depend has also had a decline in the recent few years owing to the climatic conditions. In the following graph we see how both the total production for both the Yala and Maha seasons as well as the yield per hectare has been decreasing. This leads into higher prices as well as the tendency for imports which also has the final repercussion on the state of the economy. Figure 12 explains the influence of rainfall and thereby drought on paddy production and yield.
- Tea production
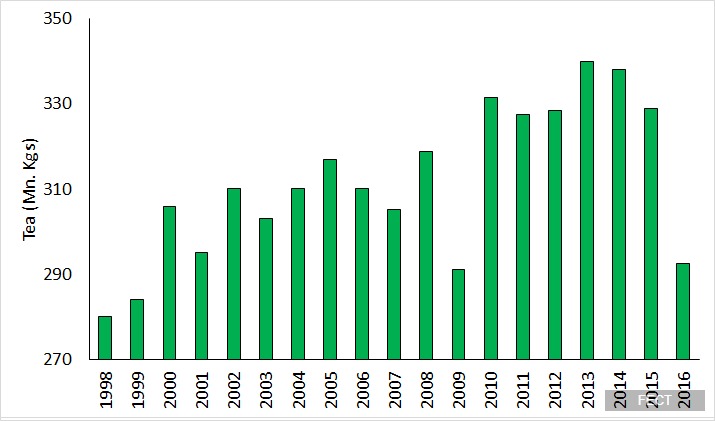
Tea has been for many years major source of foreign exchange whilst also giving employment to over a one million people directly and indirectly. Tea production which is highly sensitive to the climatic condition while also promoting the unique blend of taste and smell has also had a steady fall from 2013 reaching the lowest level it has had for nearly fifteen years with the exception of the year 2009. This is shown in figure 13.
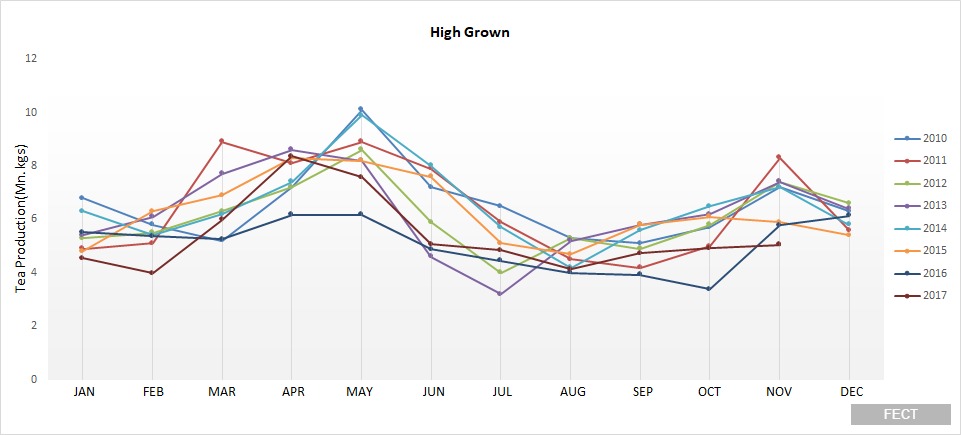
In figure 14 we see the variations which can be observed in the three main geographical locations where tea is harvested High grown, Mid grown and Low grown areas. Both the High and Low grown areas has been influenced significantly with the climatic condition especially with the dip seen in the graphs towards the months of June to September in which drought condition persisted.

- Rubber Production
Rubber has been the third largest export earner in the Sri Lankan economy and extreme weather conditions can hamper and reduce harvesting. The higher temperatures have also affected the latex flow and consequently it has had its effect on yield of rubber. In figure 15 we can see that Rubber production has reached its lowest in eighteen years. The gradual decline can be seen from five year in retrospect and due to the climatic conditions this relation becomes valid.

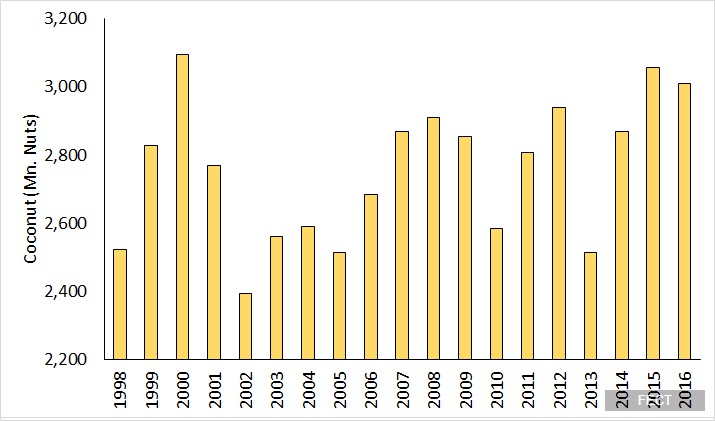
- Coconut production
The Coconut triangle comprising the areas Chilaw, Gampaha Puttalam and Kurunegala districts account for the major yield in production. Due to the drought conditions in these areas it has been reported that the yield is to drop by 20% making it difficult even for consumption rather than export and industry use. Figure 16 depicts this reduction in production
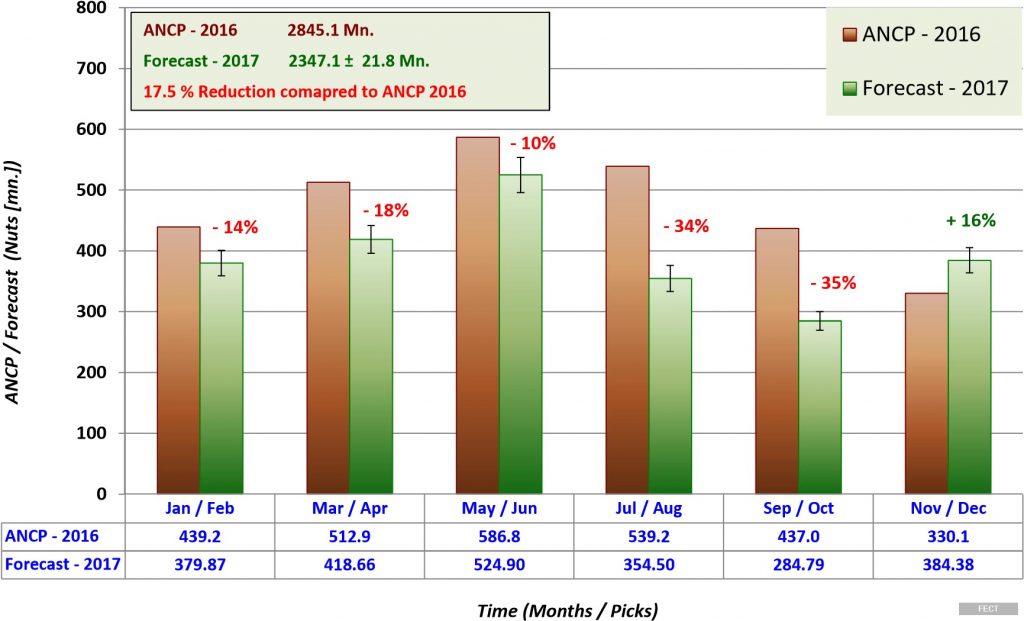
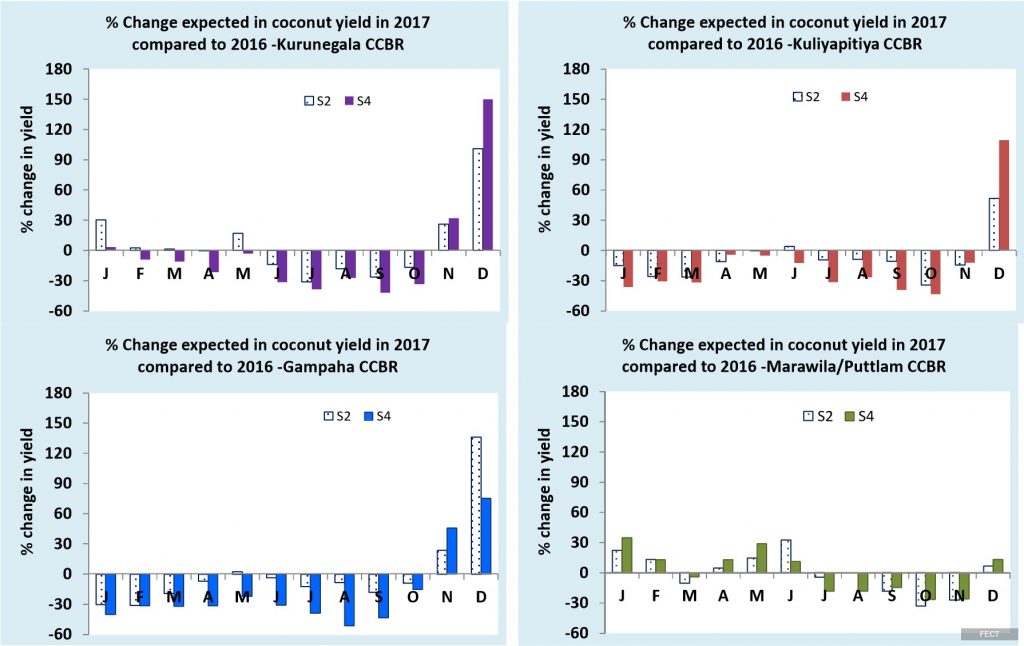
When we look at monthly figures from the coconut production major areas we see that the percentage yields have been negative less for the last two months when compared to 2017 to 2016. This is visible in figure 17.
The above changes can also be seen with the bi-monthly forecasts and reduction when compared to annual national coconut production in 2016 and 2017 as shown in figure 18.