
Heat Index
Heat Warnings to Several Districts in 2020
The general Sri Lanka has been inconvenienced due to hot weather being experienced in some parts of the country to a noticeable degree in past few months. We have identified the locations to be cautious of the hot weather in Sri Lanka for 2019 and the first four months of 2020. The Heat Index (HI) has been calculated by using relative humidity and temperature and this is a measure of how hot it really feels on the body when relative humidity is factored with the actual air temperature.
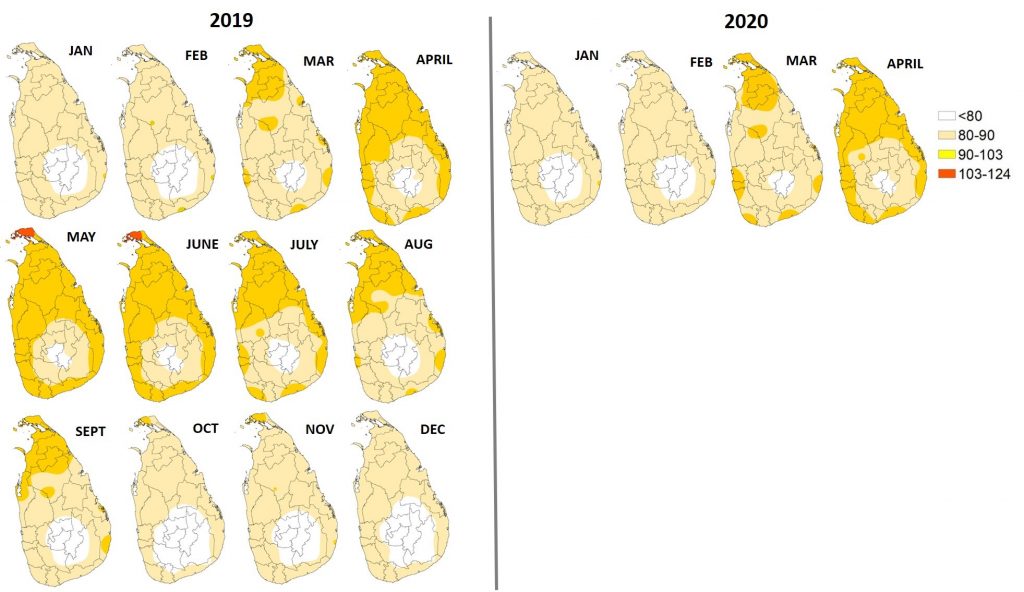
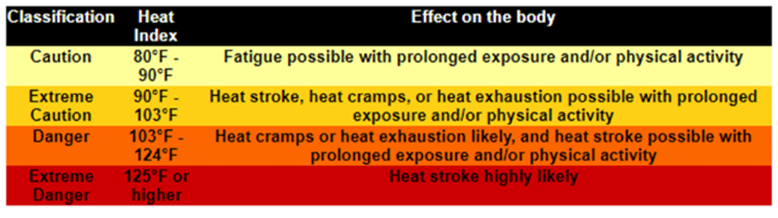 Figure 1. Monthly Average Heat Index of Sri Lanka, 2019-2020
HI classification of NOAA’s Weather Service does not show a much spatial variation of the heat stress in Sri Lanka. However, when consider the pattern of HI in the island, Comfort Level can be recognized in the stations situated in Central Highland mainly at Nuwara-Eliya, Diyathalawa and Kandy than sea level and intermediate zones. HI values are varying with the seasonal rainfall and environment lapse rate which are occurring with the nature of the topography and orography.
The monthly HI is varying from comfortable level to Extreme Caution level for the first six months and gradually declining for the rest of 2019. The same situation can be viewed for the first four months of 2020.
In January to March, Caution Level can be identified in some parts of the Northern, North Central provinces and some coastal areas. Higher temperature value from April – July is responsible for increased HI values. In this period, HI values have been gone up to “Danger” level in some parts in Northern province and “Extreme Caution” level can be identified in North Central, Eastern, North Western provinces and coastal areas and slowly gone down from August.
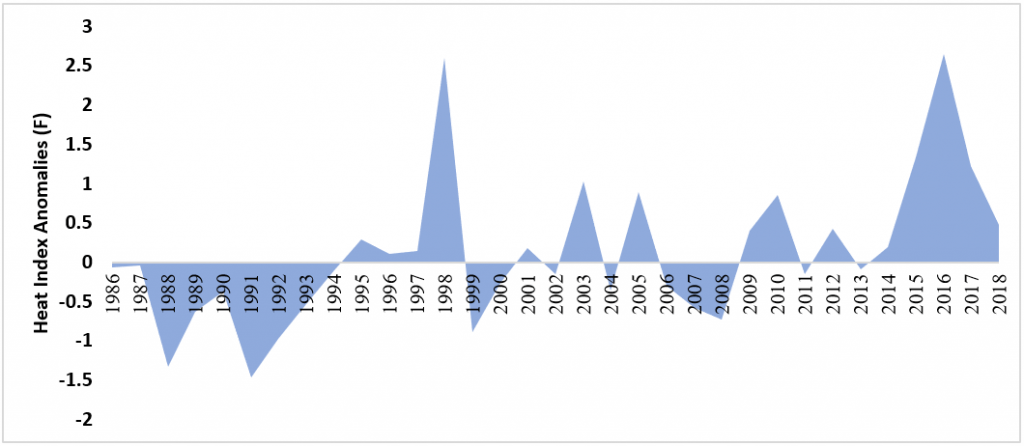 Figure 2. Heat Index Anomalies, 1986–2018
A plot of heat index anomalies shows the significantly higher anomalies for recent five years. The highest peak (2.7) was in year 2016.
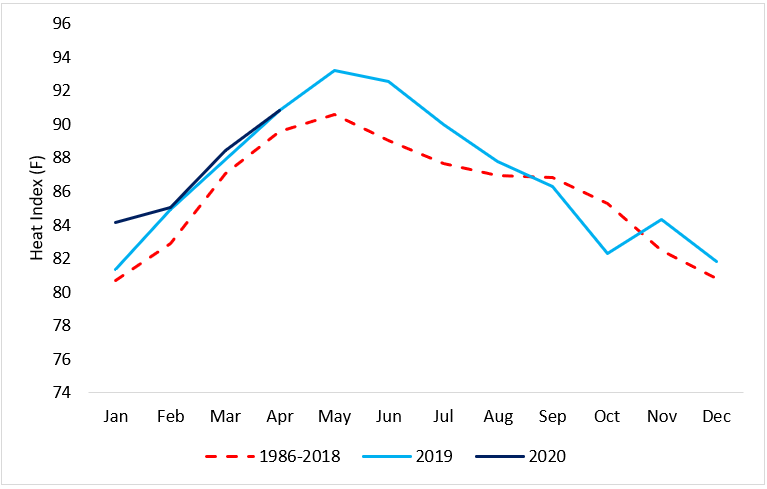 Figure 3. Monthly variation of Heat Index during recent decades
We have obtained a mean annual cycle of HI values to understand the pattern of heat index value events over the year. These annual cycles are characterized by mean of monthly HI values over the period 1986 – 2018. An upward shift in the HI values is noticeable throughout first 6 months and decline for the rest. A slightly deviation of HI in October, 2019 can be observed. According to the HI chart, April to July can be acknowledged within “Danger” and “Extreme Caution” levels and the rest of the year within Caution and Comfort Levels for the period 1986-2018.
Accordingly, the temperature felt on the human body is expected to increase up to “Danger” level at some places in North, North Central and North Western provinces while “Extreme Caution” to the Eastern, Western and Southern provinces in the next few months.