
Rainfall
Rainfall and its variation has the most direct influence on drought. If rainfall is less than what is typically expected and what folks and the ecosystems have grown accustomed to, then the impacts shall follow. Rainfall variation for drought monitoring needs to be done in near-real time. We have been working on various procedures so that we can overcome the nationally counter-productive data policies and pricing in place so as to bring out real time monitoring. We have found that satellite based data, some data that are accessible online and our own automated weather stations (which we provide unfettered access to) can be combined to estimate rainfall deficits. Below in Fig. 1 for example is a comparison of the current years rainfall with that in the previous years. We can see that in 2016 after the massive floods around 14-19th of May, rainfall has stayed well below what has been seen in previous years. Rainfall is usually high in the latter part of the year.
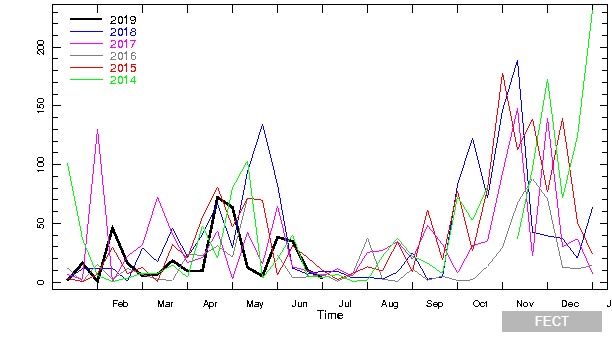
The average rainfall for each dekad over Sri Lanka estimated from satellites and ground observations is shown Figure 1 for the last 6 years as a line in a separate colour over a common January – December axis with 2019 in bold black. Figure 1 is already a harbinger of drougt in Sri Lanka by early January 2017. The deficits were sustained through April across Sri Lanka.
A more explicit way to look at drought is to compare the current rainfall average with that for the long-term average. This is what has been done in Figure 2. This too shows that the rainfall has been below average in a sustained way.
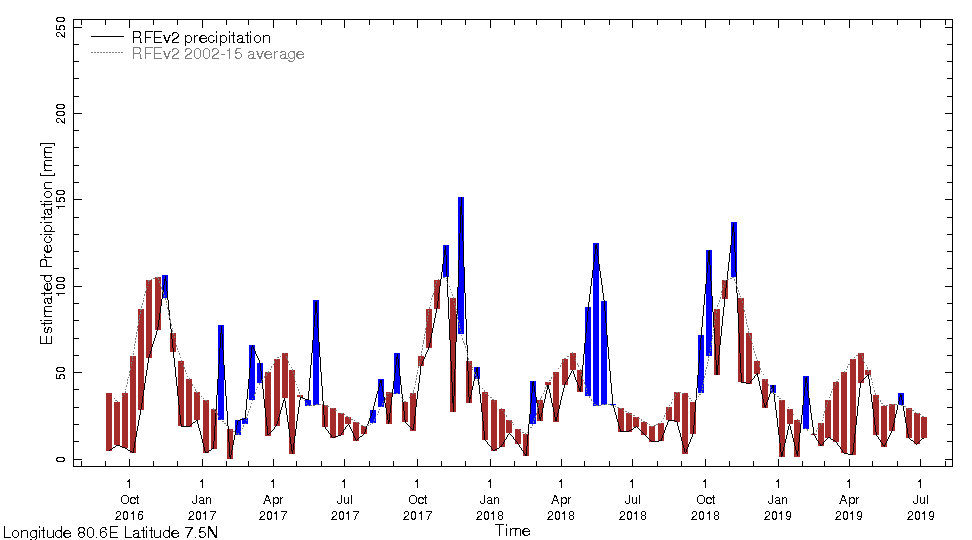
The smoother curve shows the average over 2002-2018 – this annual cycle is reproduced for each year in the above figure. The departures from this average are shown wetter (blue) and dryer (brown) for each month for the last three years. A dekad refers roughly to 10 days or more accurately as each month divided into three.
The climate of Sri Lanka has considerable regional variation – to undertand this, we can look at the month-by-month variation in rainfall anomalies (Fig. 3) – i.e the departure from the long-term average. The maps show more nuance and can be interpreted accordingly for various regions.