
Drought Index
Standardized Precipitation Index (SPI) can be taken as an index, which can be used to identify whether there has been a drought in a certain time period.
SPI, based on probability of precipitation for any time scale, is calculated as :
SPI=(X-Xm) / σ
| Where X = Precipitation for the station Xm = Mean precipitation σ = Standardized deviation |
SPI Drought Classes:Less than -2.00 Extreme drought-1.50 to -1.99 Severe Drought-1.00 to -1.49 Moderate drought-0.99 to -0.00 Mild drought |
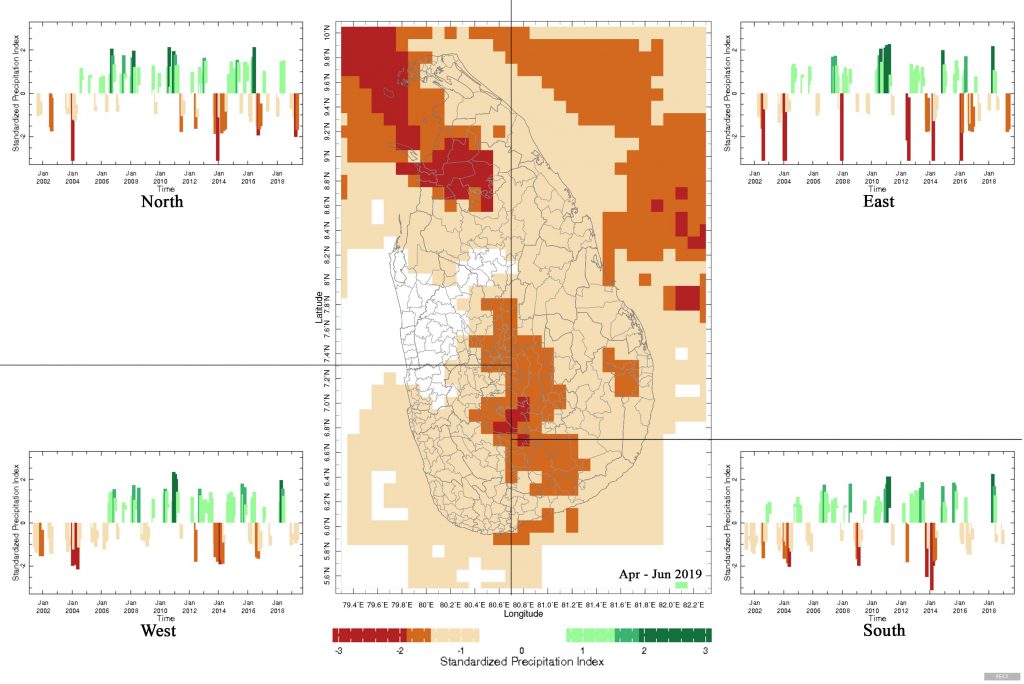
Figure 1: SPI Map for the recent 3 Months of 2019 (Apr-Jun) & 3 Monthly SPI Time Series for the 4 Climate Regions from May 2001 to Jun 2019
Three-monthly SPI time series graphs of each region are also shown in Figure 1.
- In North, Extreme droughts have occurred from Dec 2003 to Feb 2004 and from Dec 2013 to Feb 2014.
- In East, Extreme droughts have occurred in 2002 from Jul to Sep, Dec 2003 to Feb 2004, Feb to Apr 2014 and Feb to Apr 2016.
- In South, Extreme droughts have occurred from Oct to Dec 2013 and from Feb to Apr 2014.
- In West, Extreme droughts have occurred from Dec 2003 to Feb 2004 and from Apr to Jun 2004.
When considering the whole country, extreme droughts have occurred during the period from December 2003 to February 2004.
During this year, severe droughts have occurred in the period from March to May 2019.