Temperature
Drought can also be exacerbated by excessive evaporation from water surfaces such as lakes and evapo-transpiration from flora. Evaporation data while available are not yet being accessible in real time. Hence we are left with various steps to find suitable proxy for now. Remote sensed based observations of vegetation is a possibility and in our drought monitor we shall soon provide such estimates. The variables that affect evaporation are temperature, wind, and relative humidity – of these temperature is critical. Below, we see that the temperature over Sri Lanka plays a major role in the effecting of a drought.Temperature and Heat Index.
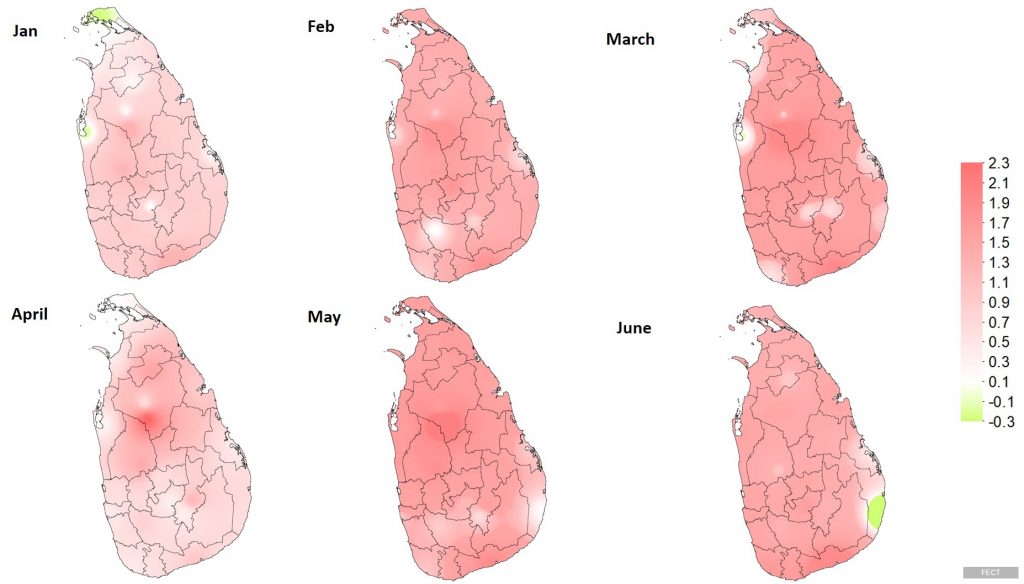
In climate change studies, temperature anomalies are more important than absolute temperature. A temperature anomaly is the difference from an average, or baseline, temperature. The baseline temperature is typically computed by averaging 30 or more years of temperature data. A positive anomaly indicates the observed temperature was warmer than the baseline, while a negative anomaly indicates the observed temperature was cooler than the baseline
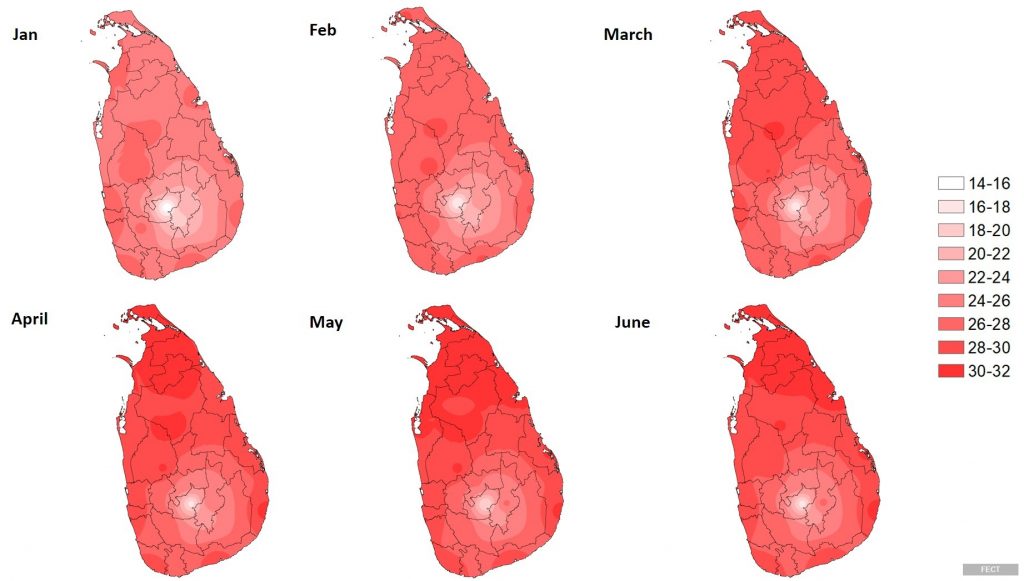
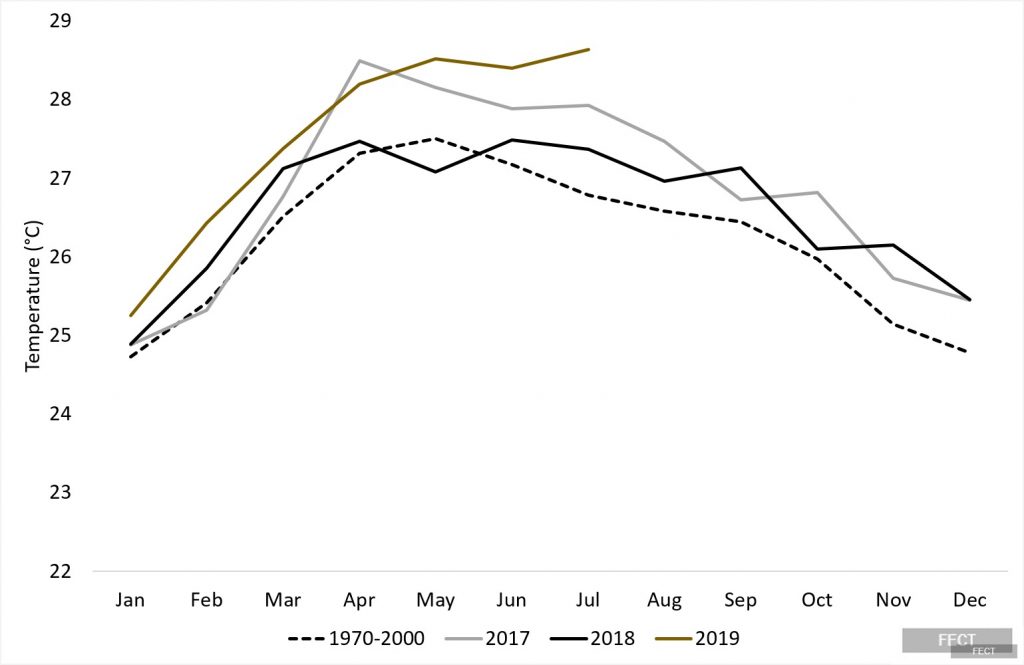
Figure 2 shows the monthly average Temperature of Sri Lanka for the First six months of 2019. The monthly average temperature is varying from 14 to 32 and the temperature values are higher compared with the previous years. Figure 3 shows the month-by-month variation in temperature anomalies to understand the regional variation of temperature.